
When Google announced last year that they were releasing a flight delay prediction feature, we were...

Many factors go into calculating the emissions impact of flying, and each methodology makes certain assumptions on the factors that matter (or do not). Ultimately, calculating emissions isn't an exact science, and none of the methods is "right" in any absolute sense. The correct question then is whether the estimates are right within the context of decisions that they drive. Lumo's APIs and reporting solutions deliver data using multiple methodologies – including Defra, ICAO, and our own proprietary calculations – to ensure you have the right data for your use case.
Within travel, there are typically two uses of emissions data:
- Post-trip reporting that measures aggregate impacts in order to drive policy, e.g., "What was the total impact of air travel across our company this year vs. last year?" or "What should our goal for next year be?"
- Pre-trip estimates to drive better traveler choices at the point of sale, e.g., "What is the impact of taking flight X vs flight Y?"
At Lumo, we believe that the industry so far has placed too much focus on the first, and not enough on the second. Current methodologies do reasonably well at measuring aggregate impacts but don't do a great job at helping travelers make better individual choices. The implications for the industry are huge: if the goal is to reduce emissions by, say 25%, the only way to achieve it in the short term using aggregate post-trip statistics is to use heavy-handed policies that cut travel by approximately 25%; however, empowering travelers to choose flights or routes that are 25% more efficient at the point of sale could yield savings faster without cutting travel as significantly. (Of course, a blend of less travel and better choices gives the industry the best shot at achieving its goals).
Defra and ICAO
Defra, a methodology published by the UK government, is the most commonly used framework for post-trip reporting. It covers not just flights, but hotels and cars too. It is easy to calculate, is easy to understand, and requires very little data. For example, the emissions from a trip are based on the distance, and little else. It is a good methodology for consistent aggregate reporting, but is unsuited to driving changes in behavior.
ICAO, a methodology published by the International Civil Aviation Organization, is more granular than Defra in that it considers adjustments for aircraft type and can help drive flight choices at the time of booking, but is still too coarse to drive changes in behavior at the point of sale.
What is needed is a technique that takes the best of both approaches to come up with a methodology that is more granular than ICAO, but in aggregate matches the assumptions made in the Defra model. That's where Lumo's proprietary calculations come in.
The factors that drive emissions calculations
Distance
This is an obvious one – a longer flight burns more fuel, leading to greater emissions. Defra assumes a linear growth model (one for short-haul and another for long-haul), while ICAO uses nonlinear curves that compute fuel burn as a function of distance. Lumo's method follows the ICAO methodology for calculating distance-based fuel-burn. The fuel burn for the aircraft is then multiplied by a constant to get the amount of CO2 emitted.
The Lumo difference: Not much really, we're just following the ICAO method.
Aircraft type
Different aircraft types have different fuel consumption profiles. Defra completely ignores this distinction and assumes that all flights of a certain distance have the same emissions impact irrespective of aircraft type. ICAO has different fuel-to-distance curves for each aircraft type.
The Lumo difference: The last ICAO publication was in 2018, before efficient aircraft such as the Boeing 737 MAX, Airbus A220, or A320neo were in widespread use. We created fuel-to-distance curves based on aircraft and engine manufacturer published data, which means a traveler can be guided toward booking flights on these more modern and efficient aircraft.
Seasonality and winds
Ever noticed how a flight from Boston to London is about an hour shorter than a London-Boston flight? Or that a Boston-LaGuardia flight takes 10 minutes longer than a LaGuardia-Boston flight? The differences are driven by jetstreams, winds, or airport configurations, which vary by season, which can significantly impact fuel consumption. Defra and ICAO do not account for these factors.
The Lumo difference: Lumo accounts for the differences in en-route time by origin-destination and time of the year to provide a more accurate accounting of fuel burn.
Seating configuration
Some seat configurations are more efficient than others – a densely packed all-economy cabin is likely a more efficient use of space than a sparser multi-cabin configuration. The Defra methodology ignores cabin configuration while the ICAO methodology assumes a global average for a given aircraft type (e.g., a typical B737 aircraft has the equivalent of x economy seats).
The Lumo difference: Lumo accounts for the seating configuration by carrier, aircraft type, and route, helping passengers choose between flight options that have different seating configurations.
Radiative forcing and emissions equivalents
Radiative forcing refers to the phenomenon by which emissions from aircraft have a greater impact since they occur higher in the atmosphere. While there isn't scientific consensus on the magnitude of the impact, the IPCC recommends a radiative forcing index (RFI) of 2.7 (i.e., the impact of emissions from aviation is 2.7 times that of equivalent emissions from, say a car on the ground), Defra uses an RFI factor of 1.9. ICAO's estimate does not include radiative forcing.
CO2 equivalents refers to the fact that burning fuel has environmental impacts other than just CO2, which means that the effective impact of flying is greater than just the CO2 emitted. Defra accounts for this, while ICAO does not.
The Lumo difference: Not much, as we just follow the Defra methodology for consistency.
Passenger load factors
A half-empty plane is clearly less efficient on a per-passenger basis than one that is full. While the Defra methodology ignores this distinction (it basically assumes an average global load factor – the ratio of the number of passengers to the available seats), ICAO assumes a fixed passenger load factor at a regional level (e.g., "all flights from North America to Europe have a load factor of x").
The Lumo difference: Lumo digs a couple of levels deeper to get the load factors by carrier, and origin and destination countries (e.g., "the average load factor for American Airlines on a flight from the US to France is x"). We obtain the load factor data from annual data submitted by the airlines to ICAO. We are looking at enhancing our stats to account for the actual number of passengers on a given flight (based on booking data) – stay tuned for more on that.
Freight factors
The ICAO methodology tries to allocate the emissions from a flight to its passengers vs. freight based on the the weight of freight carried by the aircraft, assuming averages based on the origin and destination regions. Defra effectively assumes a global average across all flights.
The Lumo difference: Similar to the passenger load factors, Lumo digs a few levels deeper to get the freight factors by carrier, origin, and destination countries, making the estimates that much more accurate.
Class of service
All methodologies recognize that a first class seat that takes up more space should be allocated a greater fraction of the emissions than an economy seat. Defra assumes that flying premium economy, business, and first lead to 1.6, 2.9, and 4.0 times greater emissions than flying economy. ICAO's methodology generates estimates for economy and premium (everything other than economy) but does not make a distinction between premium economy, business, or first.
The Lumo difference: Not much, as we follow the Defra ratios.
| DEFRA | ICAO | Lumo | |
| Distance | Yes | Yes | Yes |
| Aircraft type | No | Yes | Yes |
| Seasonality and winds | No | No | Yes |
| Seating configuration | No | Partial | Yes |
| Passenger load factors | No | Partial | Yes |
| Freight factors | No | Partial | Yes |
| Class of service | Yes | Partial | Yes |
| Radiative forcing & CO2 equivalents | Yes | No | Yes |
We are proud to say that Lumo's methodology has been independently verified by Carbon Footprint.
.png?width=265&height=143&name=Carbon%20Footprint%20Verified%20Method%20(1).png)
Click to download white paper
The Lumo API
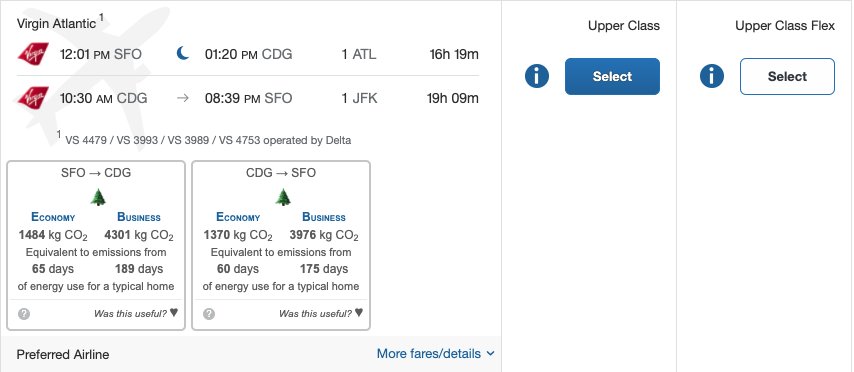
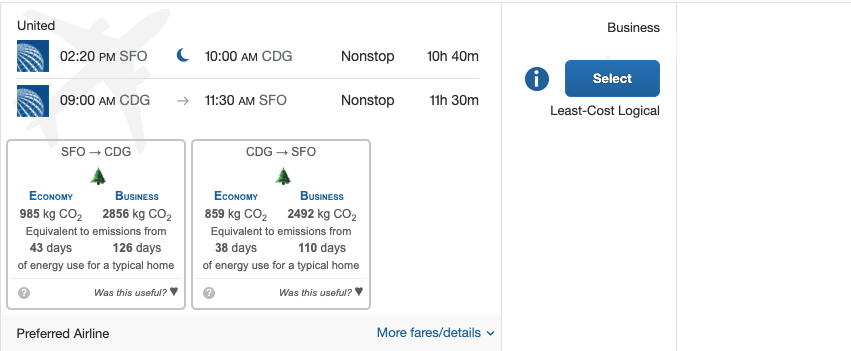
We're excited to announce that our flights API now includes detailed emissions estimates. A single call to the Lumo API returns the CO2/CO2e impact of a flight using all three methodologies (Defra, ICAO, and Lumo) so you can choose what is best for your application. Defra may continue to be the best for consistency in reporting, but we strongly believe that the Lumo methodology is the best suited to booking tools to help influence behavior at the point of sale, by helping identify differences by aircraft type, carrier, seating configuration, and cabin class. For example, our Concur browser extension (screenshot below) runs on the Lumo API, helping deliver precise emissions estimates to travelers, empowering them to make more sustainable choices.
Curious what Lumo's API, browser extension, or reporting solutions can do for you? Get in touch and we'd be happy to help.
Contact Us